The business world is highly competitive and data-oriented today. Leveraging data in the right way can mean the difference between business success and failure. As a result, funnel diagrams have become one of the most powerful tools that businesses can use for analyzing data and driving informed decision-making. Keep reading to comprehend more about their significance.

Table of Contents
Understanding the Concept of Funnel Charts
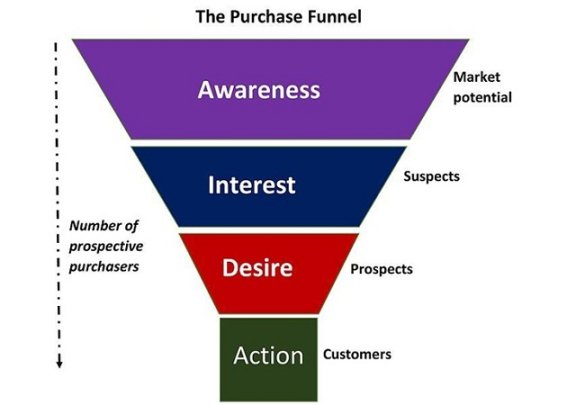
Simply put, a funnel chart is a graph that displays data in various stages of a process. It has a unique shape, decreasing gradually, often resembling a funnel, hence its name. It helps visualize and analyze how data flows in different stages, highlighting issues that may arise along the way.
The top end of the funnel chart usually represents the first stage of the process and contains the largest quantity of data. It progressively narrows down, indicating the amount of data decreasing as it moves toward completion. With such an arrangement, organizations can not only monitor the process but also identify bottlenecks or leakage points.
It’s worth noting that funnel charts are widely used across a variety of fields, from marketing and sales to user experience. They can effectively illustrate the customer’s journey through a purchasing process or the user’s navigation through a website, to give a few examples. It makes them a versatile and powerful data tool.
Boosting Sales Performance With Funnel Charts
When it comes to boosting sales, funnel charts can be a real game-changer. They enable an organization to visually represent the steps customers take in the buying process and where potential customers drop off along the way. This provides sales teams with a clear view of where the most substantial opportunities lie and where further nurturing or focusing resources could yield better results.
Another benefit that funnel charts bring to sales is providing a sense of direction. Sales teams can use them to structure their process better and work out tactics for moving prospects to the next step in the funnel. It also aids in setting more realistic targets based on a comprehensive understanding of the sales process.
Enhancing Marketing Outcomes
Funnel charts play an essential role in the realm of marketing as well. Market trends, audience behavior, campaign success—all these elements can be analyzed and visualized using funnel charts, thereby clearing the path to enhanced marketing outcomes.
Marketers can use funnel charts to map out a customer’s journey, discovering crucial touchpoints that can make or break the transaction. Additionally, funnel charts are an effective device for depicting how different marketing channels contribute to goal conversion, allowing a more nuanced understanding of channel effectiveness.
In a nutshell, funnel charts provide marketers with a clear view of their strategy’s effectiveness. Areas that need attention become visibly apparent, and useful insights are gleaned to revise and improve the marketing strategy over time.
Revamping User Experience (UX) Design
In an age deeply steeped in digital experiences, user experience (UX) design has become pivotal to business success. Here also, funnel charts come to the rescue. They provide UX designers with invaluable insights into user navigation patterns and highlight areas where users commonly encounter difficulties.
By interpreting the data in funnel charts, UX designers can identify potential pain points in the user journey and work toward providing an optimized, enjoyable experience. The goal is to ensure users reach the desired end-point seamlessly, whether it’s making a purchase, signing up for a newsletter, or booking a service. Funnel charts have, therefore, become an indispensable tool in the UX designer’s arsenal.
Redefining Business Strategy and Decision-Making
Funnel charts have undeniably revamped the mode of business strategy and decision-making. A clear visual of data, highlighting issues, scope for refinement, and potential outcomes, has changed the way businesses strategize and make decisions.
By visualizing processes and their effectiveness, funnel charts help identify areas needing improvement. This ability to pinpoint precisely where a process is faltering aids businesses in making informed, strategic decisions faster. Furthermore, using funnel charts to track and monitor progress can assist in keeping strategies dynamic and responsive to real-world variables and changes.
Lastly, funnel charts assist in defining meaningful business goals and Key Performance Indicators by understanding the present scenario in detail. By determining where the business stands, decision-makers can set realistic milestones and deadlines, ensuring the growth and success of the organization.
Altogether, Funnel charts hold the promise of powerful data visualization and analysis, helping businesses navigate their way to success in today’s data-centric world.


